Content
Why Include KPI Definitions in Your Reports?
When it comes to reporting, the ultimate goal is to make insights actionable and meaningful for your audience.
Creating impactful reports involves several considerations: selecting the right visualizations, carefully choosing colors, and structuring the report in a way that’s easy to understand. However, one of the most critical aspects often overlooked is ensuring that users fully comprehend the metrics and KPIs presented in the report.
Over the years, I’ve encountered various approaches to achieve this, including:
- Adding explanations in text fields within the report
- Creating an additional page with detailed guidance and context
- Leveraging the new DAX
.infofunctions to dynamically document measures, even showcasing the formulas behind them (assuming users find those understandable, of course 😉)
While these methods have their merits, I’ve found one approach to be particularly robust and scalable: Integrating KPI definitions as a shared data source and using custom tooltips to display them within your reports.
Let’s explore how this can be done effectively.
Centralized and Reusable KPI Definitions
The first step in creating impactful reports is to ensure your KPI definitions are centralized and accessible to everyone in the organization. This is a foundational practice for fostering a strong data culture. By centralizing KPI definitions, you enable all stakeholders to use consistent terminology and align their understanding when discussing data and insights.
While a PDF or Word document with strict revision control could serve this purpose, a more efficient approach involves documenting your definitions in tools like SharePoint lists, Confluence pages, or even Excel sheets (though Excel should only be a fallback if no better options are available). For our needs, having a tabular source for KPI definitions that can be connected to Power BI is essential.
Once connected to Power BI or Fabric, these definitions can be incorporated into a shared semantic model or integrated as part of a datamart, data warehouse, or lakehouse. For this example, we’ll focus on creating a shared semantic model due to its lightweight nature and ease of sharing with other report creators in your organization.
To make things more interesting, let’s assume your KPI documentation resides in Confluence rather than SharePoint or Excel. Here’s how to integrate Confluence tables with Power BI.
Connecting Confluence Tables to Power BI
To connect to Confluence tables, you’ll need to use the Confluence API. Before proceeding, ensure you have an API token for your account. You can find instructions for creating an API token in the documentation: Manage API tokens for your Atlassian account | Atlassian Support
Using Power Query, you can connect to a specific Confluence page by utilizing its page ID and the appropriate API endpoint. For complete details, refer to the Confluence Cloud REST API Documentation.
Step 1: Identify the Page ID of Your Confluence Page
- Navigate to the desired Confluence page.
- Click the three-dot menu in the upper-right corner.
- Select Advanced Details -> Page Information
- Locate the Page ID in the URL
Step 2: Connect Power BI to the Confluence Page
To retrieve data from a Confluence page, you’ll need to construct an API call tailored to your specific Atlassian domain and page ID. For instance, if your page ID is 20119554, your API call might look like this:
https://YourDomain.atlassian.net/wiki/api/v2/pages/20119554?body-format=storage
Open Power BI Desktop and Launch PowerQuery
- Use the Web Connector in PowerQuery to initiate the connection
Set Up the API Call
- Enter the cURL call constructed earlier
- Replace
YourDomainwith your actual Atlassian domain and ensure the page ID matches the desired Confluence page.
Authenticate the Connection
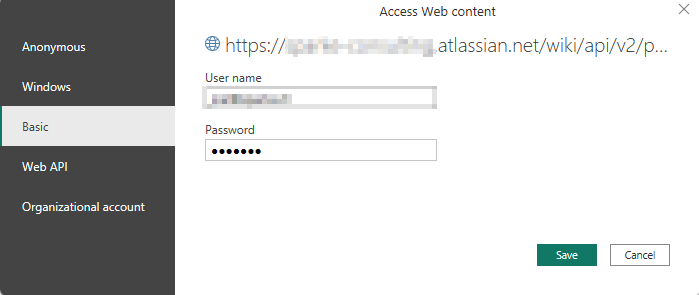
- Select Basic Authentication in PowerQuery
- Use your Atlassian email as the username
- Enter the API token you generated earlier as the password.
Navigate to the Body Record
Once connected, navigate to the body record in the data structure and isolate its value. This will give you the raw HTML content of the Confluence page.
Simplify the Data Extraction
Since the raw HTML content may not be directly useful for analysis, I’ve created a custom function that processes the Value column to extract and clean the relevant data for further use.
Step 3: Use a function to extract tables from HTML
To process the raw HTML content from your Confluence page and extract table data, you’ll need to create a custom function.
					(TableHTML as text) as table =>
let
    // Step 1: Split the HTML content to isolate each <table> tag
    ExtractTables = Text.Split(TableHTML, "<table"),

    // Step 2: Remove content before the first <table> tag
    RemoveNonTables = List.RemoveFirstN(ExtractTables, 1),

    // Step 3: Reconstruct each table with <table> and </table> tags
    AddTableTags = List.Transform(RemoveNonTables, each "<table" & Text.BeforeDelimiter(_, "</table>") & "</table>"),

    // Step 4: Extract LocalID and <tbody> content
    CreateColumns = List.Transform(AddTableTags, each [
        LocalID = try Text.Replace(Text.BeforeDelimiter(_, "<tbody>"), """", "'") otherwise null,
        TBodyContent = try Text.BetweenDelimiters(_, "<tbody>", "</tbody>") otherwise null
    ]),

    // Step 5: Create a table from the extracted data
    CreateOutputTable = Table.FromList(CreateColumns, Splitter.SplitByNothing(), {"SplitData"}),

    // Step 6: Expand the extracted columns into separate columns
    ExpandColumns = Table.ExpandRecordColumn(CreateOutputTable, "SplitData", {"LocalID", "TBodyContent"}),

    // Step 7: Transform the LocalID column to extract the LastInQuotes
    ExtractLastInQuotes = Table.TransformColumns(
        ExpandColumns,
        {{"LocalID", each Text.BetweenDelimiters(_, "ac:local-id='", "'"), type text}}
    ),

    // Step 8: Parse the TBodyContent to include the header row, make sure to adjust the number of columns if needed!
    ParseHtmlTable = Table.AddColumn(
        ExtractLastInQuotes,
        "ParsedTable",
        each try Html.Table(
            "<table><thead>" & Text.BetweenDelimiters([TBodyContent], "<thead>", "</thead>") & "</thead><tbody>" & [TBodyContent] & "</tbody></table>",
            {
                {"Column1", "tr > th:nth-child(1), tr > td:nth-child(1)"},
                {"Column2", "tr > th:nth-child(2), tr > td:nth-child(2)"},
                {"Column3", "tr > th:nth-child(3), tr > td:nth-child(3)"},
                {"Column4", "tr > th:nth-child(4), tr > td:nth-child(4)"},
                {"Column5", "tr > th:nth-child(5), tr > td:nth-child(5)"},
                {"Column6", "tr > th:nth-child(6), tr > td:nth-child(6)"},
                {"Column7", "tr > th:nth-child(7), tr > td:nth-child(7)"},
                {"Column8", "tr > th:nth-child(8), tr > td:nth-child(8)"},
                {"Column9", "tr > th:nth-child(9), tr > td:nth-child(9)"},
                {"Column10", "tr > th:nth-child(10), tr > td:nth-child(10)"}
            },
            [RowSelector = "tr"]
        ) otherwise null,
        type table
    ),

    // Step 9: Promote the first row of ParsedTable to be the header
    PromoteHeaders = Table.TransformColumns(
        ParseHtmlTable,
        {{"ParsedTable", each if _ <> null then Table.PromoteHeaders(_, [PromoteAllScalars=true]) else null, type table}}
    ),

    // Step 10: Remove the TBodyContent column
    RemoveTBodyContent = Table.RemoveColumns(PromoteHeaders, {"TBodyContent"})
in
    RemoveTBodyContent
Step 4: Invoke the function to extract the tables
I can then use the function to invoke it on the HTML Content column. So the full query to the tables inside a confluence page is as follows
					let
    Source = Json.Document(Web.Contents("https://YourDomain.atlassian.net/wiki/api/v2/pages/20119554?body-format=storage")),
        #"Converted to Table" = Record.ToTable(Source),
    #"Filtered Rows" = Table.SelectRows(#"Converted to Table", each ([Name] = "body")),
    #"Expanded Value" = Table.ExpandRecordColumn(#"Filtered Rows", "Value", {"storage"}, {"Value.storage"}),
    #"Value storage" = #"Expanded Value"{0}[Value.storage],
    #"Converted to Table1" = Record.ToTable(#"Value storage"),
    #"Filtered Rows1" = Table.SelectRows(#"Converted to Table1", each ([Name] = "value")),
    #"Invoked Custom Function" = Table.AddColumn(#"Filtered Rows1", "GetConfluenceTables", each GetConfluenceTables([Value])),
    GetConfluenceTables1 = #"Invoked Custom Function"{0}[GetConfluenceTables],
    ParsedTable = GetConfluenceTables1{0}[ParsedTable],
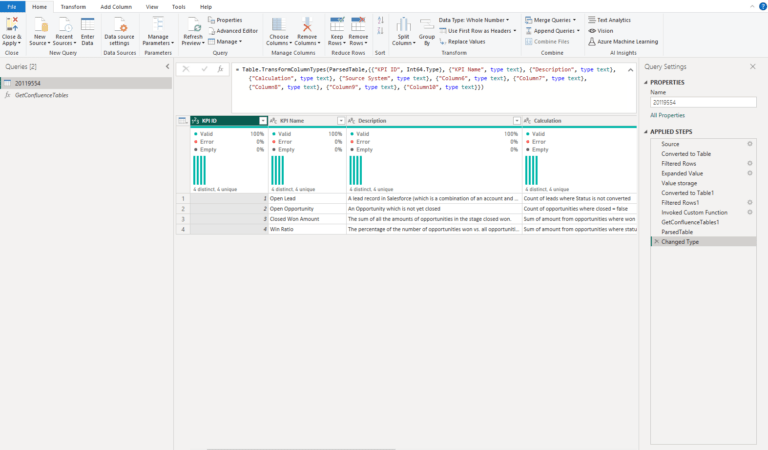
    #"Changed Type" = Table.TransformColumnTypes(ParsedTable,{{"KPI ID", Int64.Type}, {"KPI Name", type text}, {"Description", type text}, {"Calculation", type text}, {"Source System", type text}, {"Column6", type text}, {"Column7", type text}, {"Column8", type text}, {"Column9", type text}, {"Column10", type text}})
in
    #"Changed Type"
Next, navigate to the table data and expand it, especially if the page contains multiple tables. Once expanded, you’ll see all the extracted table content. At this point, you can clean up your query by removing unnecessary columns and making any additional adjustments to suit your reporting needs.
Adding KPI Definitions to Your Report
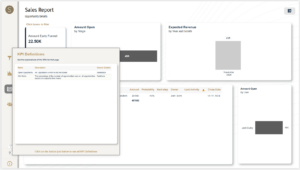
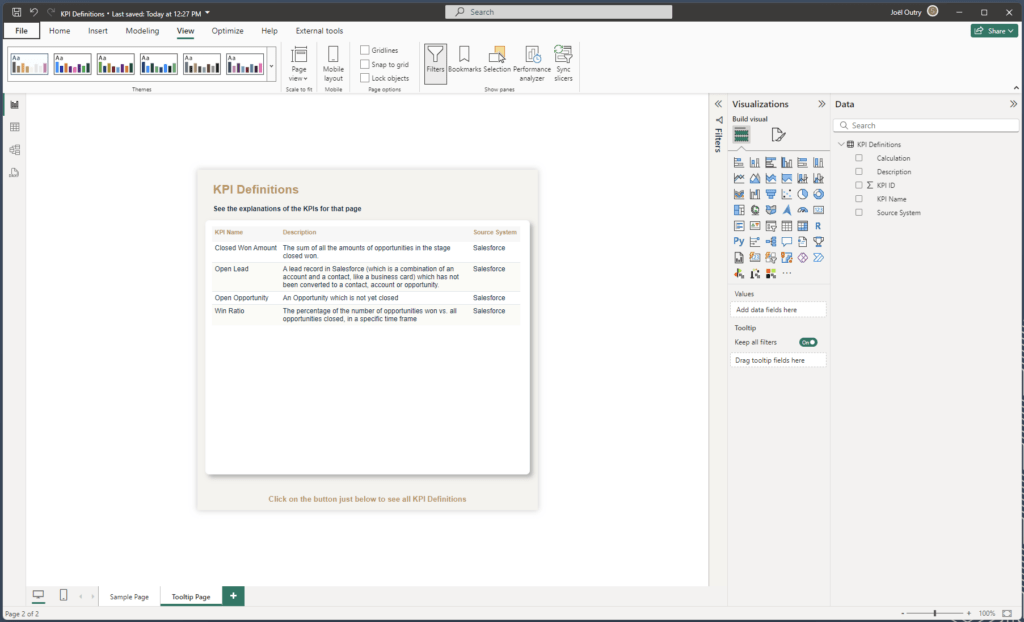
After successfully loading the KPI definitions, the next step is to incorporate them into a shared semantic model. Additionally, you can design a reusable custom tooltip and button to seamlessly integrate the definitions across your reports.
Setting Up the Custom Tooltip Page
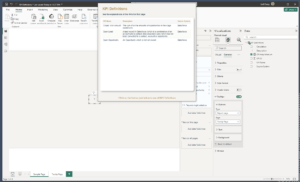
Start by configuring the canvas size and properties for your custom tooltip. Enable the “Allow use as tooltip” setting and set the page size to 600px by 600px (or adjust to your preferred dimensions). Customize the design to align with your report’s visual style and requirements.
Using the Custom Tooltip
After setting up the custom tooltip, the next step is to trigger it in the appropriate places within your report. For instance, it can be displayed when hovering over a card visual. However, keep in mind that Power BI does not support custom tooltips on text, images, or buttons.
To work around this limitation, the simplest approach is to use a card visual. To make it functional, you’ll need a helper measure to provide content for the card visual. In this example, I created a simple measure containing an emoji as text:
KPI Help Measure = "❔"
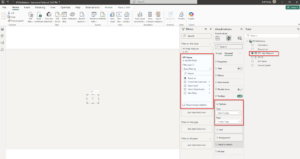
Add the helper measure to a card visual and format it to blend seamlessly into your report by removing the background, border, and shadow.
Next, link the card visual to the custom tooltip via the Formatting Options. To ensure relevance, add the KPI Name as a filter to the card visual and select only the KPIs you want displayed on the specific page. This approach allows you to showcase only the relevant KPI definitions tailored to each report page.
Once your semantic model is ready, upload it to a shared location where other report builders can easily connect to it. Using the same approach, you can replicate the custom tooltip across all reports, ensuring consistency in how KPI definitions are presented.
If your organization uses a corporate Power BI template, consider incorporating the tooltip and its connection to the shared semantic model into the template. This will help standardize its use across all reports, ensuring consistency and alignment among report creators.
This technique was also leveraged when designing the Salesforce Sales Report Template for Power BI.
This process demonstrates that connecting Power BI to data stored in Confluence is not only feasible but also an excellent solution for managing reusable KPI definitions across your organization.
I hope this guide helps drive your organization toward a more data-driven culture. I’d love to hear your comments or feedback!


